Subindustry

Theme parks.

Strategic advice for theme park owners, operators and investors on profitable growth, capital investment and park performance.

Client challenges
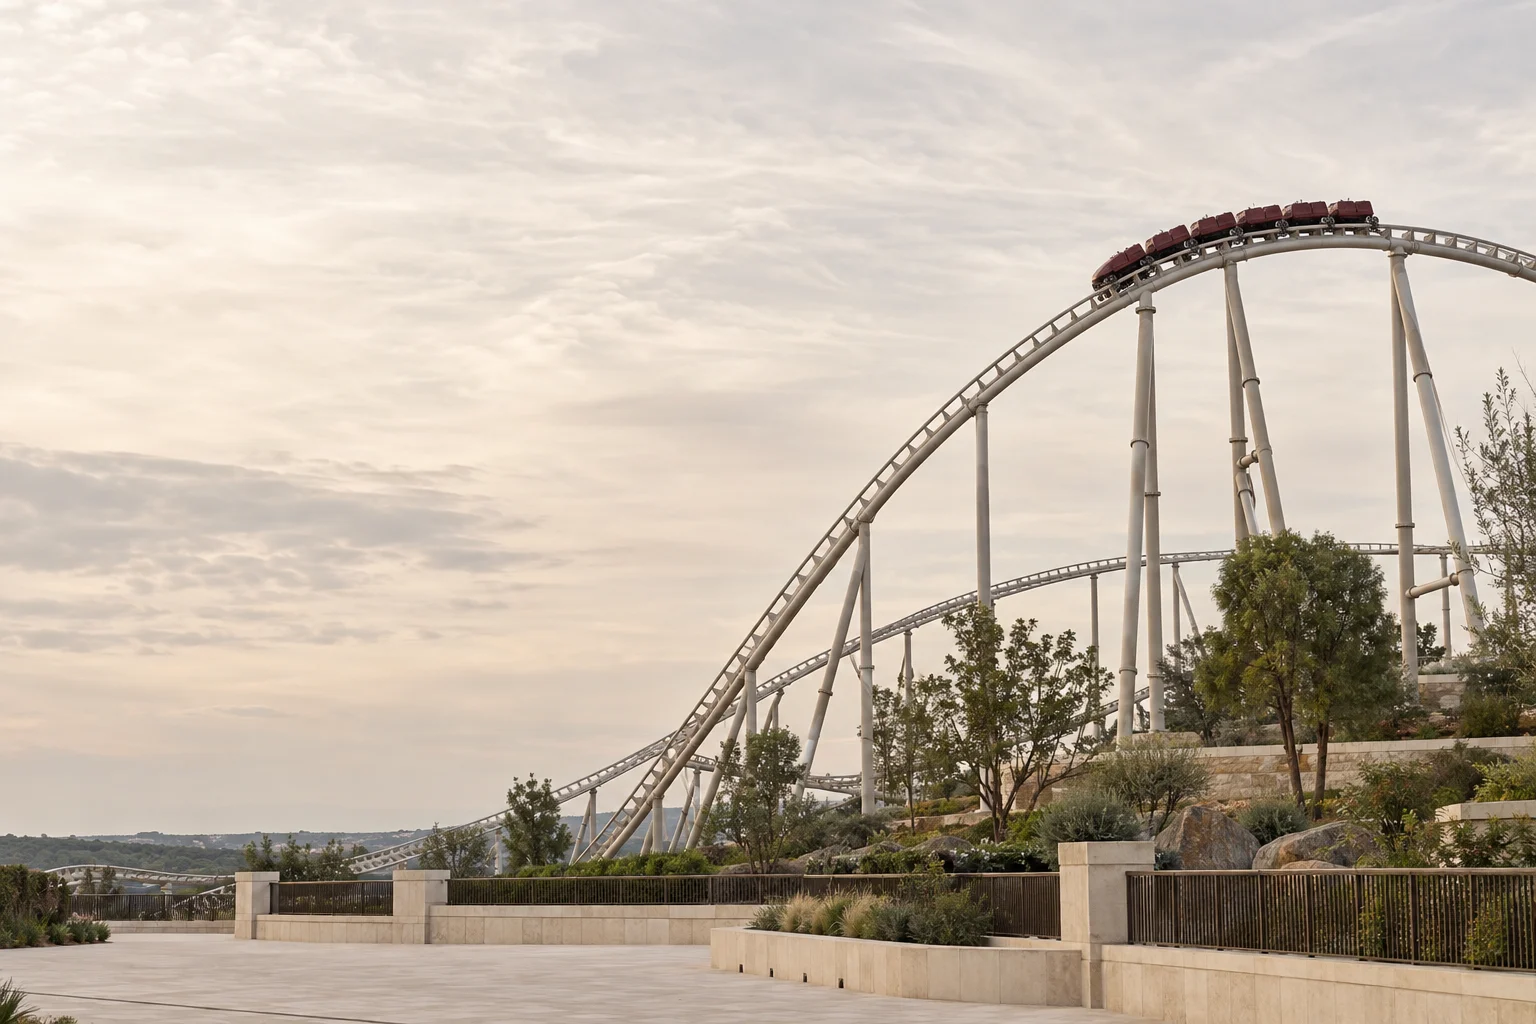
A pale steel roller coaster with a burgundy train above a quiet landscaped park, framed by an expansive soft sky.

Our industry perspective

Profitable growth starts with demand the park can serve.

More visitors, a new attraction or a hotel create value only when the additional earnings justify the costs and capital required.

Theme park owners and operators work with us on three connected decisions.

  • Prove the demand.

    Define who will visit, why they will choose the park and what they will pay.

    Regional demand
  • Improve the guest economics.

    Connect pricing and spending with the capacity and cost of serving each visit.

    Guest economics
  • Commit capital against evidence.

    Prioritize renewal and growth against whole-life returns and delivery readiness.

    Capital choices
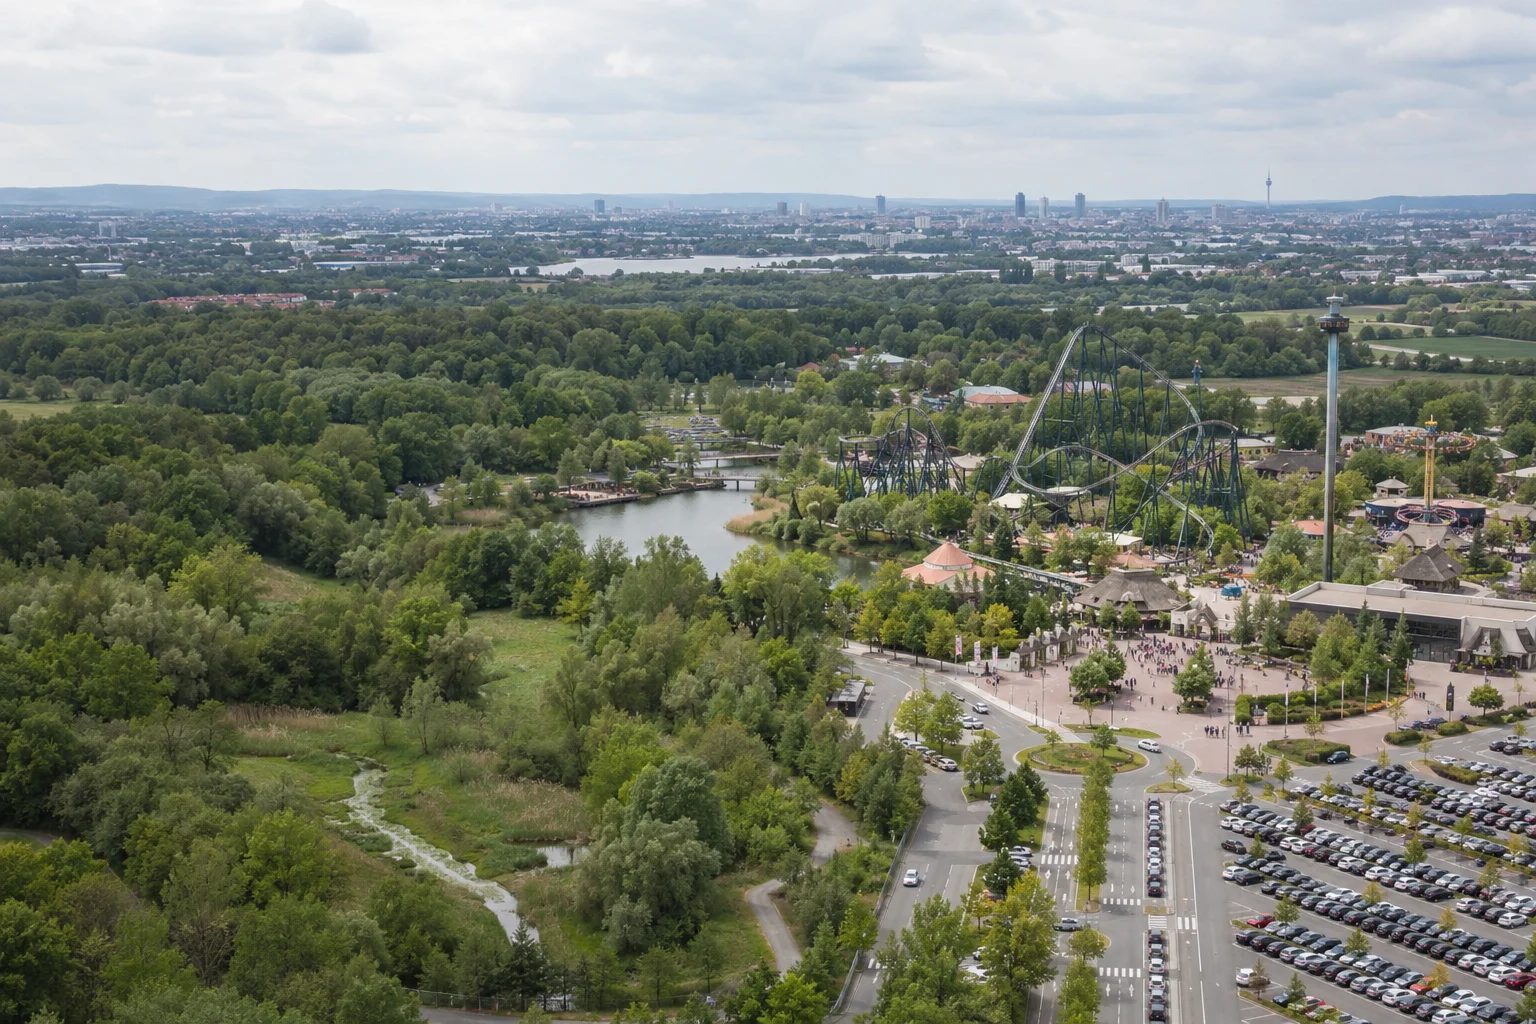
A regional park, arrival roads and its surrounding metropolitan catchment.

Theme parks

Regional demand

Build the demand case around the visit you can win.

A destination resort, a regional park and an indoor attraction sell different visits.

Start with the demand you can win, establish the guest economics, then decide where to commit capital.

2026–2027+The next investment cycle is about profitable demand.

New capacity raises the bar for the whole destination.

Separate local repeat visits from tourism-led stays before choosing the offer, operating calendar and investment scale.

Match the format to the catchment

A regional park needs a credible drive-time catchment, repeat demand and an operating calendar that covers fixed costs.

A destination resort needs reasons to stay, transportation access and distribution that can attract guests beyond the local market.

An indoor attraction needs sufficient visits within its trading radius and a price that supports rent, staffing and repeatable experiences.

Estimate visits from each segment separately. Resident population and tourism arrivals are not the same as demand for the proposed attraction.

Outlook reviewed October 19, 2026.
Results, forecasts and announced developments are distinguished below.

North America

New capacity must cover its operating costs.

Win more of the vacation budget while covering the full operating cost of expansion.

North America outlook

Comcast’s Q2 2026 results show the trade-off. Epic Universe supported Orlando revenue growth.

Its global Theme Parks segment grew revenue 2.7%, while adjusted EBITDA fell 5.1%.

Our 2027 lens: connect pass economics, resort packaging and a distinctive offer to incremental contribution.

Comcast · Q2 2026 results
EMEA

New resorts need demand beyond opening.

Underwrite each destination on local demand, seasonality and a credible ramp-up case.

EMEA outlook

Disneyland Paris opened Disney Adventure World’s expansion in March 2026.

Universal’s UK resort is planned for 2031. Disney’s announced Abu Dhabi resort adds to the longer-term Gulf pipeline.

Our European lens is repeat visits and season extension. In the Gulf, it is tourism integration and climate resilience.

African investment cases need locally grounded demand and infrastructure assumptions.

Disney · Paris opening, March 2026
Universal · UK development plan, June 2026
Miral · announced Abu Dhabi development

Asia

Guest spending needs its own growth plan.

Validate city-level demand and test attendance and spending as separate drivers of contribution.

Asia outlook

Oriental Land forecasts 28.0 million visits for the year ending March 2027, up 1.7% on FY3/26.

Net sales per guest are forecast at ¥18,712, also up 1.7%. This is a Tokyo Disney Resort outlook, not an Asia-wide forecast.

Our 2027 lens: connect domestic travel patterns and localized experiences to a credible contribution-per-guest case.

Oriental Land · FY3/27 forecast
Growth strategy
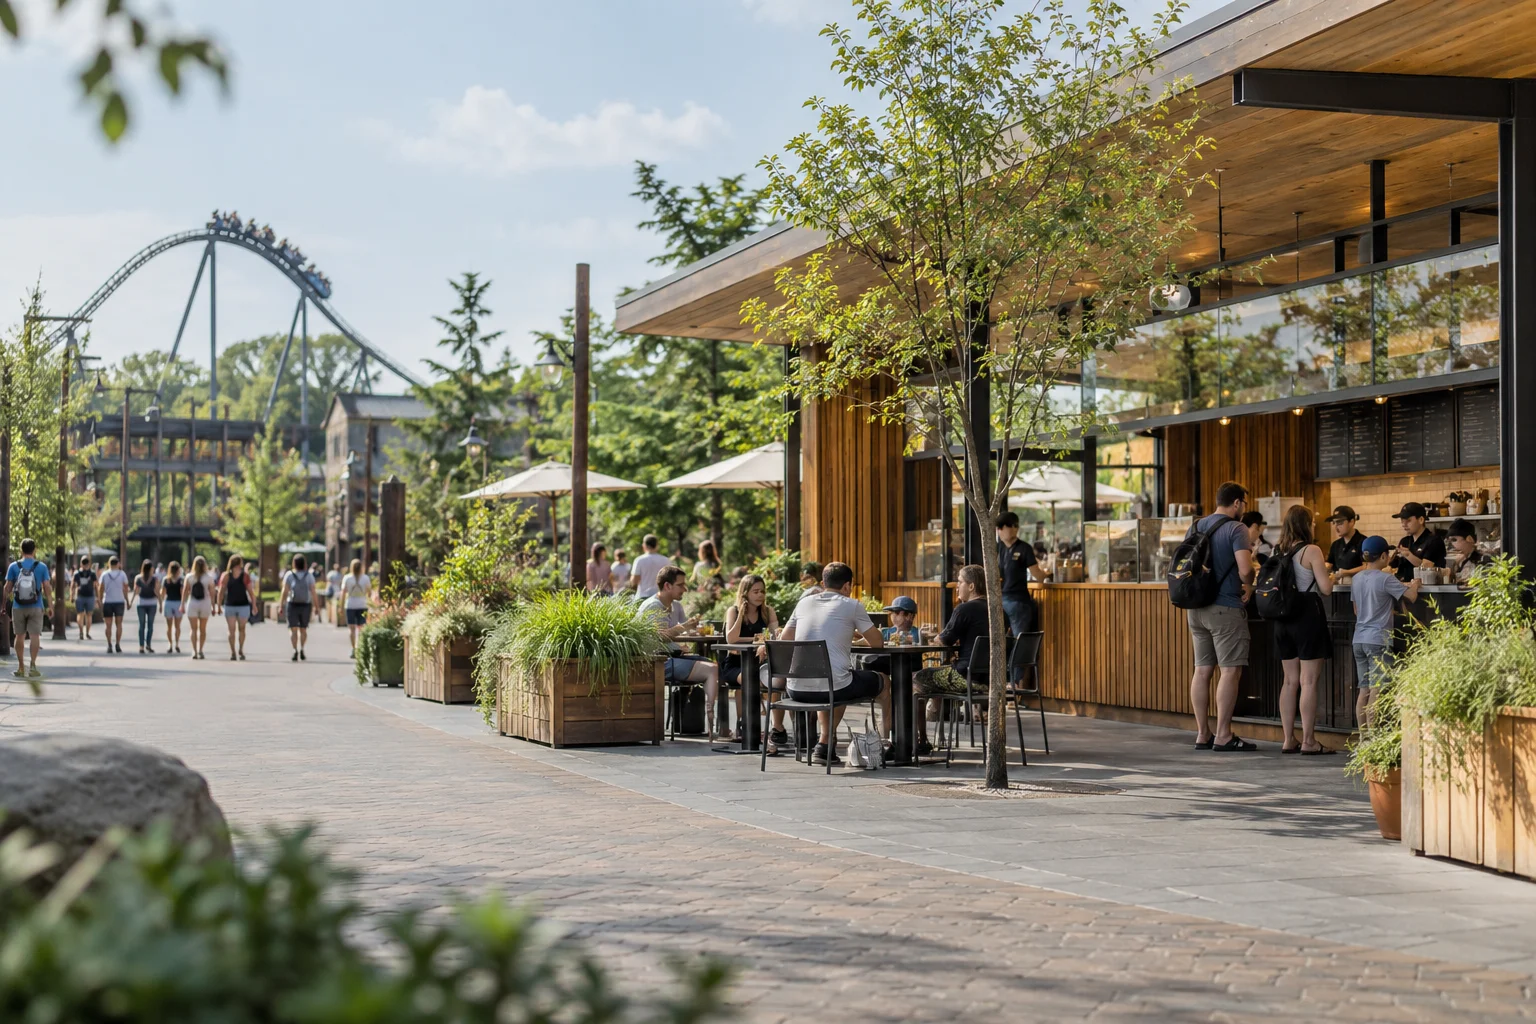
Guests at a contemporary park food-service pavilion and outdoor tables.

Theme parks

Guest economics

Attendance growth must translate into profit.

Ticket yield, in-park spending and the cost of the visit must work together.

More visitors can overwhelm capacity. Higher prices can weaken repeat demand when the experience fails to keep pace.

The 2027 earnings challenge

Oriental Land forecasts higher sales and lower profit.

Oriental Land Group · March 2026 actual vs March 2027 forecast
Fiscal years ending March 31 · outlook reviewed October 19, 2026

Group net sales

+2.8%
Group net sales, ¥ billionFiscal year ended March 31, 2026 actual: 704.5. Fiscal year ending March 31, 2027 forecast: 724.3. Forecast change versus actual: 2.8 percent. Bars start at zero. Forecasts are not reported results.¥ billion0400800704.52026Actual724.32027Forecast

Group operating profit

-4.5%
Group operating profit, ¥ billionFiscal year ended March 31, 2026 actual: 168.4. Fiscal year ending March 31, 2027 forecast: 160.8. Forecast change versus actual: -4.5 percent. Bars start at zero. Forecasts are not reported results.¥ billion0100200168.42026Actual160.82027Forecast

The 2027 plan must account for cost growth alongside revenue growth.

Group figures include businesses beyond park admissions.
Dashed bars show management forecasts.

Read the financial context

For FY3/27, Oriental Land forecasts higher sales but lower operating profit as personnel and other costs rise.

These group figures are not industry averages. Percentage changes compare FY3/27 forecasts with FY3/26 actuals; forecasts may change.

Oriental Land · FY3/27 forecast

Use discounts to fill spare capacity.

Target quieter dates and guests who would not otherwise visit.

Protect peak-day yield when a discount would displace full-price demand.

Remove service bottlenecks before adding outlets.

Test whether lost sales reflect queues, stock availability or an unappealing offer.

Compare menu, staffing and payment changes with the cost of a new outlet.

Test higher yield against repeat demand.

Track return visits and complaints alongside ticket and in-park spending.

A premium offer must earn its price without weakening the wider guest experience.

Compare visits on contribution

Start with admission, food, retail and paid-experience revenue, net of discounts, refunds and sales commissions.

Deduct the costs that change with the visit, including merchandise, food and additional operating hours. Compare visit dates and customer segments on a consistent basis.

A profitable extra visit does not establish that the whole park earns an adequate return. The annual plan must also cover fixed costs, maintenance and the capital employed.

Pricing & revenue strategy
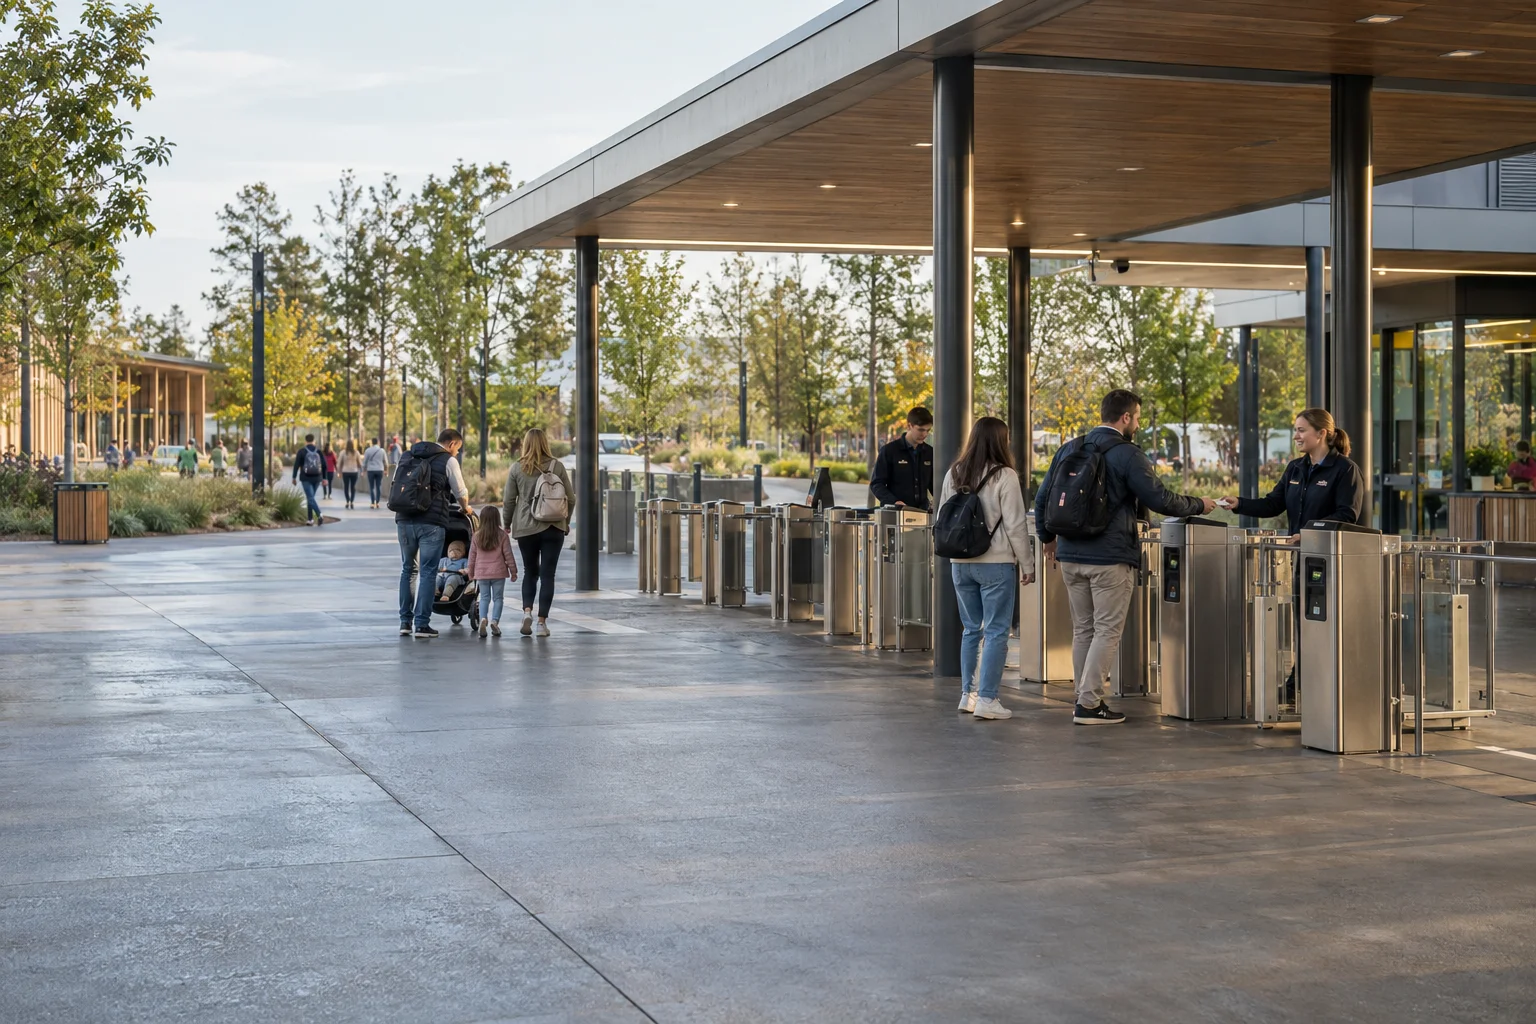
Admission staff helping guests at a contemporary park entrance.

Theme parks

Park operations

Align staffing and capacity before buying more demand.

More demand can lengthen queues and increase service costs when teams plan in isolation.

Use one demand forecast to coordinate arrival, attractions, food service and staffing.

  1. Before the visit

    Forecasts inform staffing plans.

    Forecast demand from bookings, weather, school calendars and events.

    Use it to plan pricing, staffing and food preparation.

    Watch: forecast error by day type
  2. At arrival

    Arrival planning reduces entry queues.

    Coordinate parking, access control and first-attraction demand.

    Prevent the entry process from becoming the first bottleneck.

    Watch: entry throughput and wait time
  3. In the park

    Live data supports capacity recovery.

    Track live queues, attraction availability and outlet demand.

    Coordinate dispatch, team breaks, replenishment and guest updates.

    Watch: availability and service time
  4. After the visit

    Guest feedback shapes return offers.

    Connect feedback and purchase behavior to service recovery, pass renewal and a relevant next reason to visit.

    Watch: repeat visits and contribution

Our reference architecture

Shared guest data connects bookings and service.

The business needs to recognize one trip across bookings, entry, spending and service.

Start with a hotel stay that includes park and water-world access. Prove that journey before extending the connections.

Explore the guest-data architecture
  1. Capture the visit across every offer

    Connect tickets, passes, hotel reservations, dining, retail, water-park access, VR and event bookings.

    Keep specialist operating systems where they serve the business well.

  2. Make identity and permissions travel with it

    Link reliable guest and booking references. Distinguish the booker from the people attending.

    Reconcile entitlements, payments and preferences through controlled interfaces. Build in consent, access rights and data-quality ownership.

  3. Turn connected information into decisions

    Resolve service issues, recommend a relevant next visit and plan demand across the resort.

    Measure contribution across the whole stay. A departmental sale is not necessarily new resort revenue.

Connect guest, workforce and asset data where they improve decisions on forecasting, replenishment or service triage.

Evaluate AI against the existing process. Keep safety-critical controls with qualified engineering and operations teams.

Technology strategy & architecture
Operational performance
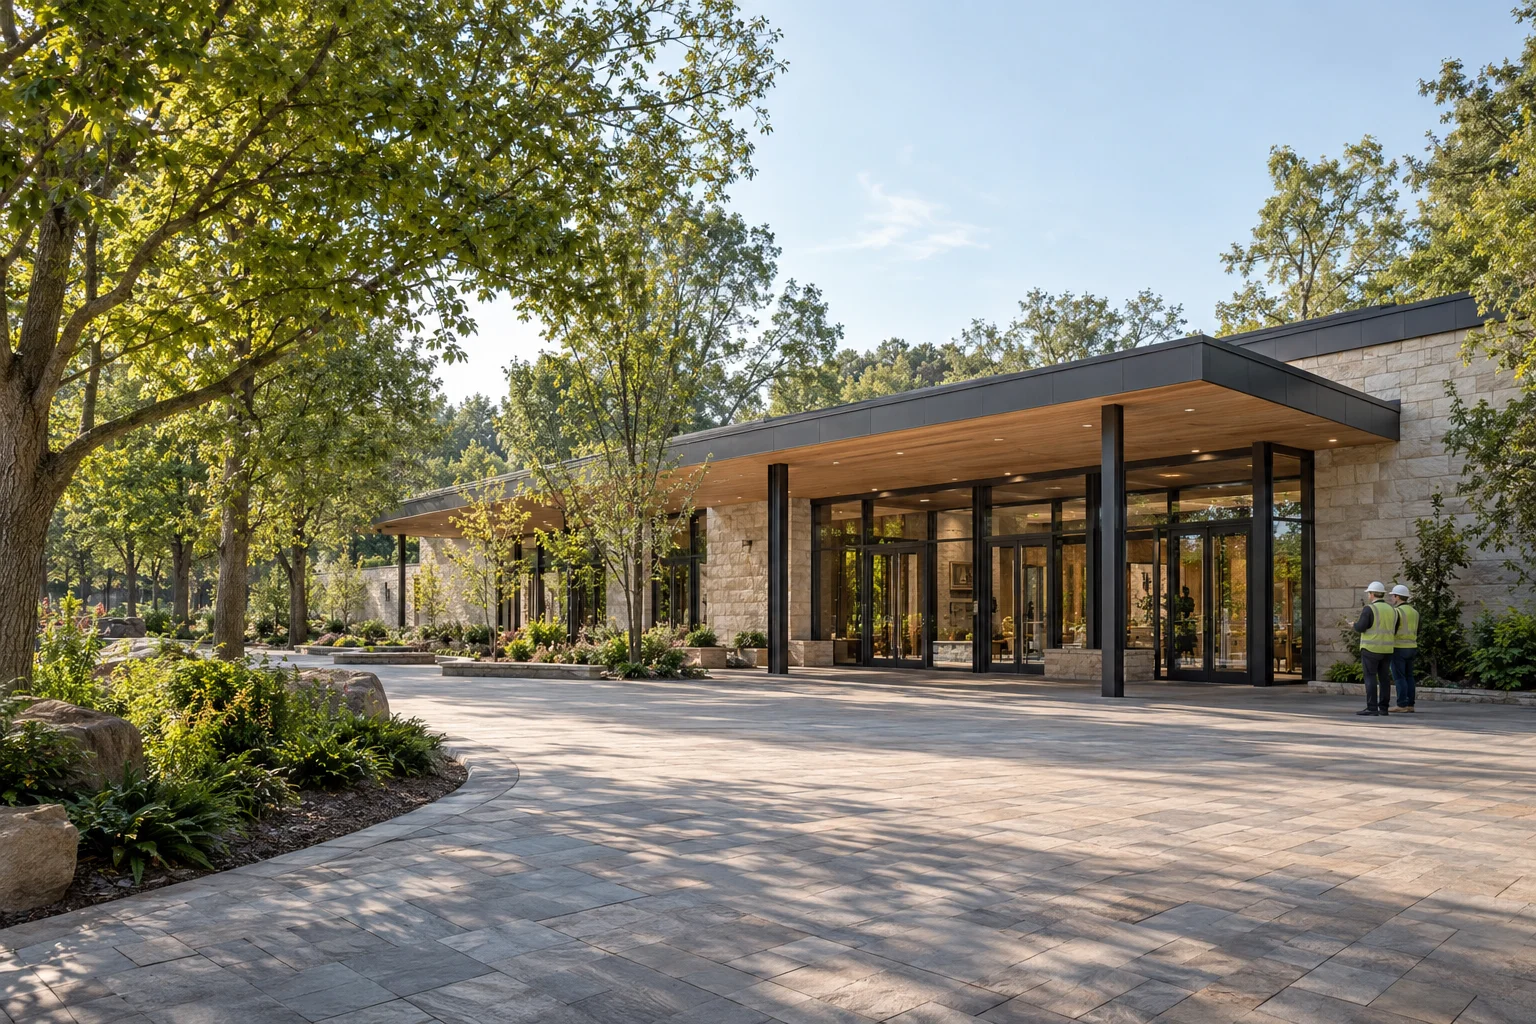
Project engineers inspecting a newly completed attraction pavilion and landscaped entrance plaza.

Theme parks

Capital investment

Capital allocation must balance renewal and expansion.

Start with the constraint on sustainable cash generation.

Compare renewal, capacity relief and new demand on consistent assumptions before choosing the next attraction.

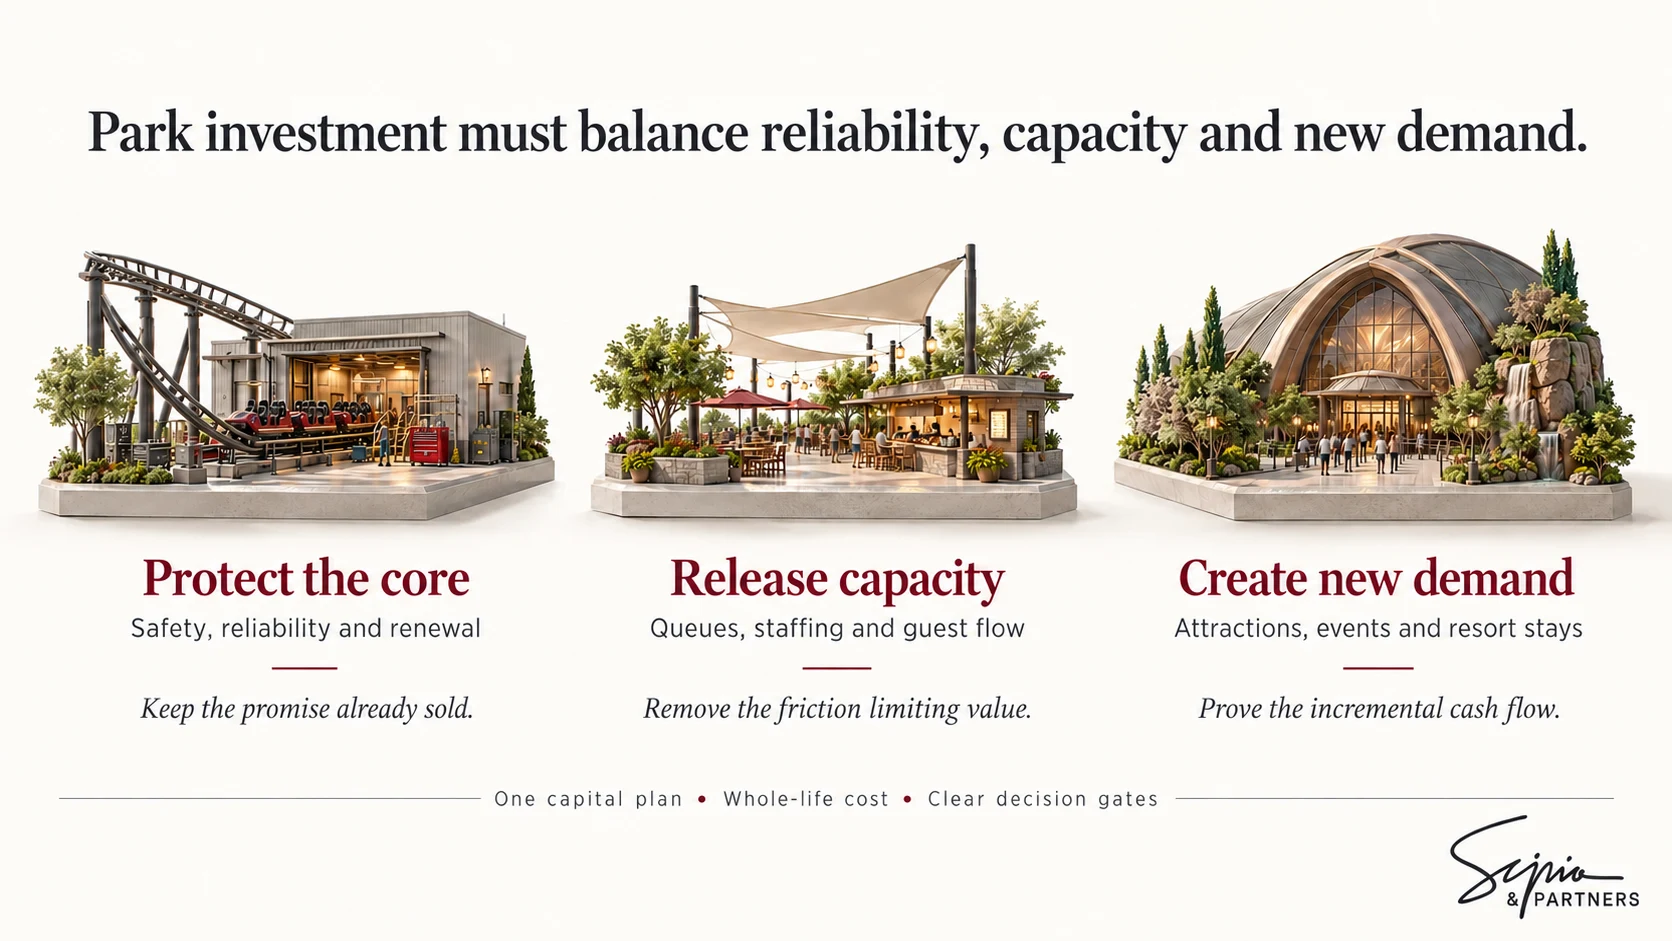
Park investment must balance reliability, capacity and new demand.

Three investment priorities: protect the core through safety and renewal, release capacity through better guest flow, and create new demand through attractions and resort stays.
Read the framework
Protect the core
Safety, reliability and renewal protect the experience already promised to guests.
Release capacity
Address queues, staffing and guest flow before paying to attract demand the park cannot serve well.
Create new demand
Test incremental visits, spending and stays from new attractions, events and lodging.

One capital plan connects all three priorities. Evaluate whole-life cost and release funding through clear decision gates.

View full size investment framework (opens in a new tab)

Expansion must remain viable under weaker demand.

For the 2027 budget, separate committed renewal from optional growth.

Phase 2028+ expansion against demand and delivery milestones.

Review the downside tests

Model slower demand ramp-up, weather exposure and construction delays.

For licensed intellectual property, include royalties and the operating obligations attached to the brand.

For hotels and new lands, separate genuinely new demand from spend shifted elsewhere in the portfolio.

Portfolio & capital allocation
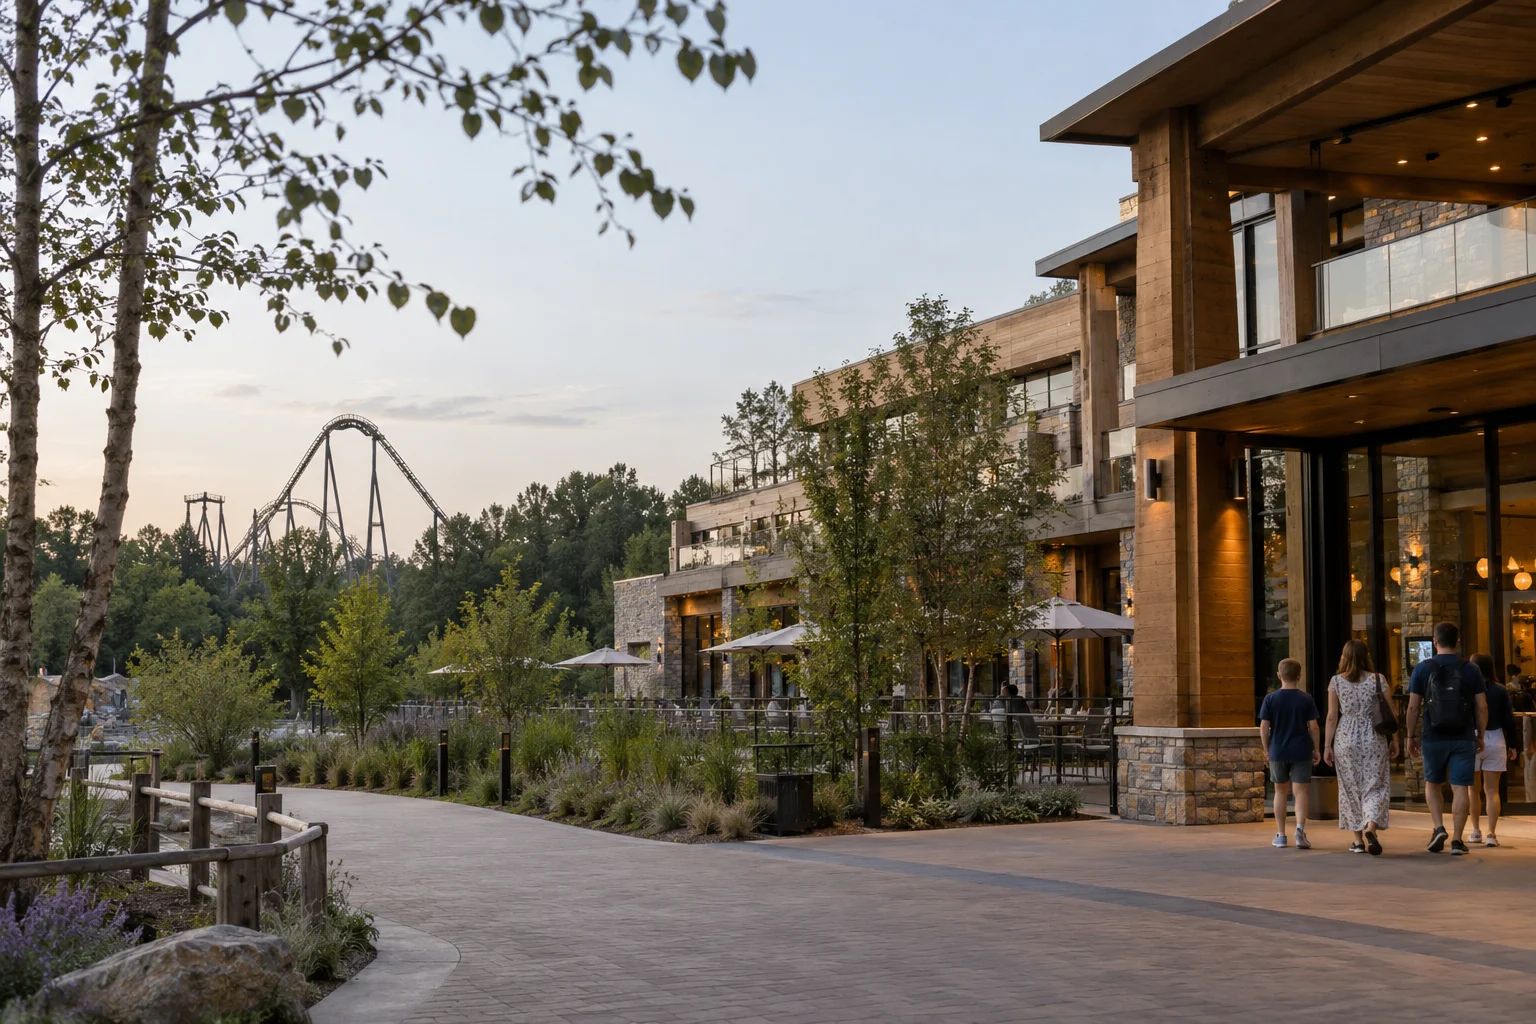
A contemporary hotel and pedestrian connection to nearby park attractions.

Theme parks

Resort growth

Resort expansion must create additional guest demand.

Europa-Park illustrates how a destination can grow around a strong core park.

The strategic question is which addition creates a longer stay, a new occasion or a different customer.

EUROPA-PARK · GROWTH ADJACENCIES

Europa-Park creates more occasions to visit, stay and spend.

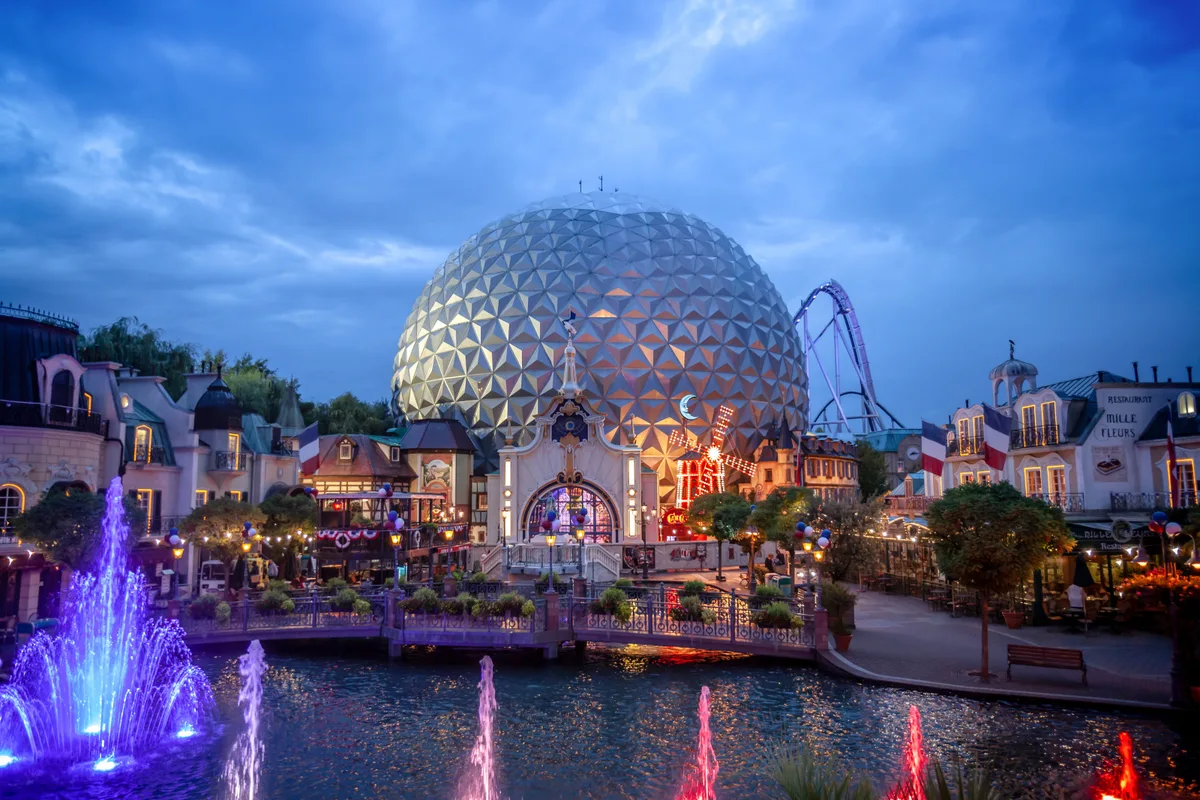
Eurosat – CanCan Coaster and the French themed area at Europa-Park at dusk.
THE CORE DESTINATION

Europa-Park

Rides, shows, dining and retail

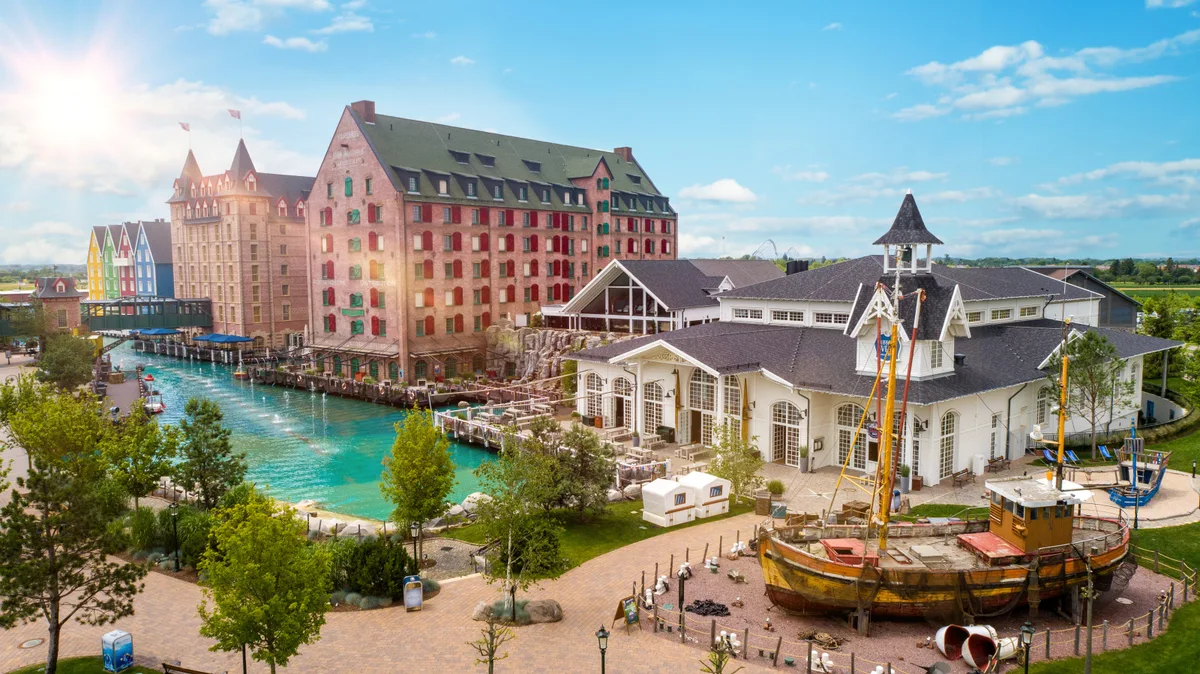
  • Hotel Krønasår and the waterfront at Europa-Park Resort.

    Stay longer

    Themed hotels · Silver Lake City

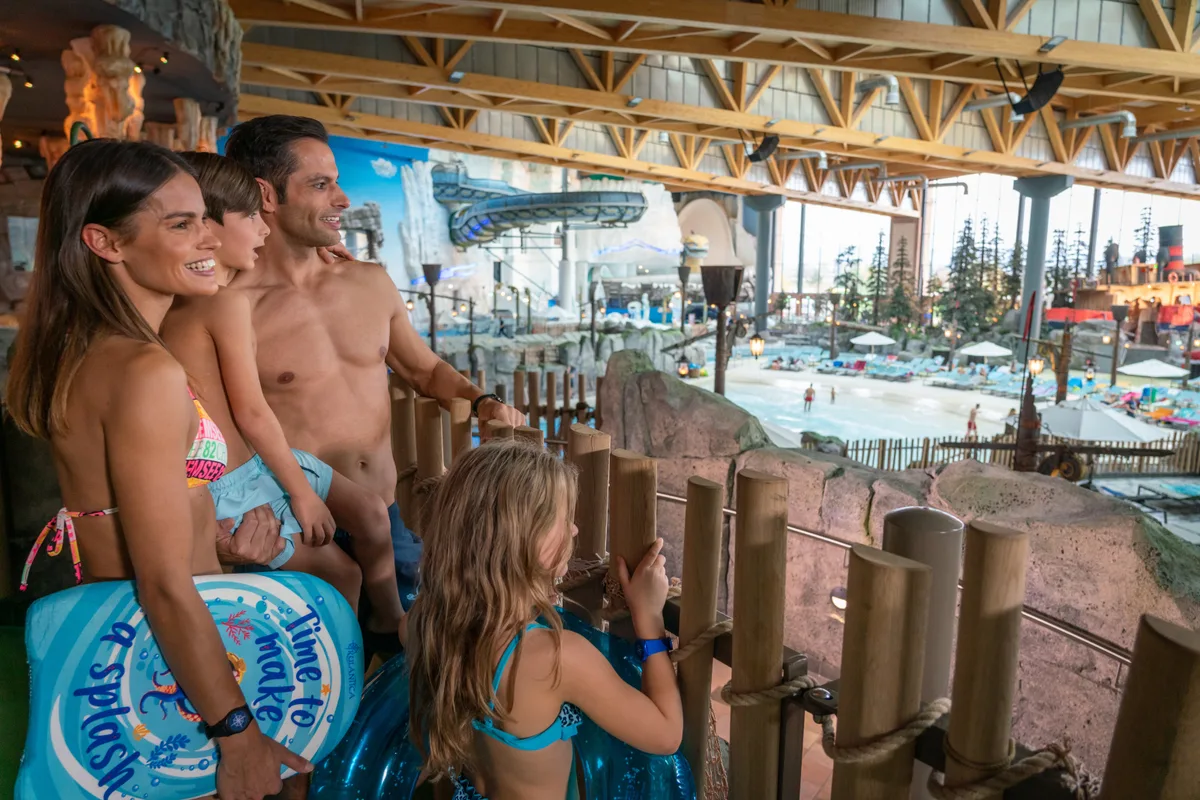
  • A family overlooking the indoor water world at Rulantica.

    Add another day

    Rulantica water world

  • Costumed performers in a theatrical horror scene at Traumatica.

    Extend the calendar

    Traumatica · seasonal events · live shows

  • A participant wearing a YULLBE virtual-reality headset.

    Create new occasions

    Eatrenalin · fine dining · YULLBE · Coastiality

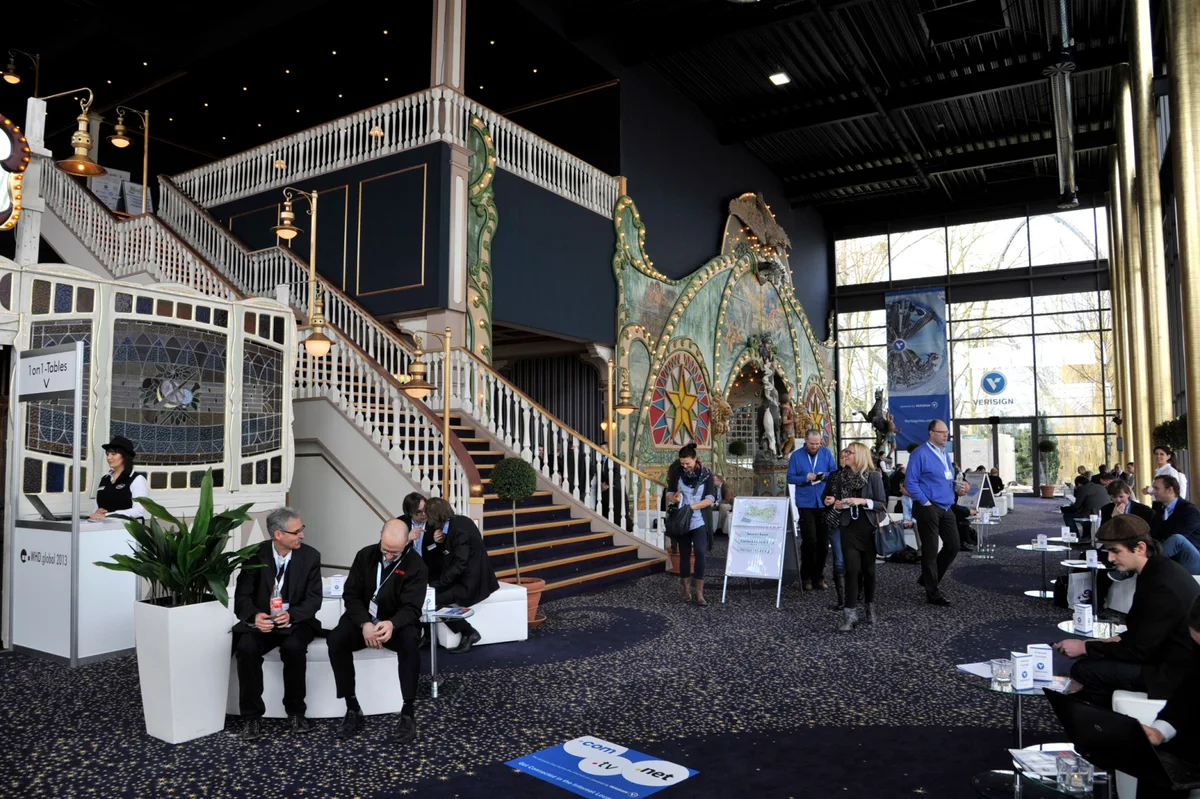
  • Delegates meeting inside the Europa-Park Confertainment Center.

    Serve business guests

    Confertainment · meetings · events

SHARED ENABLERS

Guest relationships · booking · payments · mobility · operations

Photos: Europa-Park photo library (opens in a new tab) · Analysis: Scipio & Partners

Explore the growth map

Start with rides, shows, dining and retail. The map groups growth options; it does not prescribe a building sequence.

One offer can support several visit occasions. Count additional demand once across the resort, rather than adding each business unit’s forecast together.

Stay longer

Six themed hotels and Silver Lake City, including lodge, camping and RV options.

Capture a greater share of the trip and reach guests who live beyond a comfortable day visit.

Investment test: Incremental room nights and resort contribution after distribution and operating costs.

Add another day

Rulantica adds a water-world experience to the destination.

Give the household a different reason to extend its stay, with an indoor offer that broadens weather resilience.

Investment test: Additional visit days and spending, separated from demand transferred out of the theme park.

Extend the calendar

Traumatica horror events, Halloween, the winter season, Dinner-Show, movie screenings and live entertainment.

Create new occasions to return and serve audiences with different interests and visiting patterns.

Investment test: Contribution on otherwise weaker dates, including event production and staffing costs.

Create new occasions

Eatrenalin, fine dining, YULLBE GO and Coastiality combine food, storytelling and immersive technology.

Develop premium and shorter-format visits. YULLBE GO at Silver Lake City can be booked without park admission.

Investment test: Standalone demand, repeatability and contribution per available experience slot.

Serve business guests

Confertainment connects meetings, conferences and corporate events with the wider resort.

Use lodging, venues and entertainment for an additional customer group with a different buying cycle.

Investment test: Net event contribution and displacement of leisure demand on the same dates.

Shared guest relationships, booking, payments, mobility and operations support all five growth options.

The guest-data architecture sets out Scipio’s recommended capabilities. The growth map analyzes Europa-Park’s public offer.

Europa-Park · official resort offer

Choose the adjacency that solves the constraint

Each addition needs an incremental demand case.

A hotel does little for a park without enough reasons to stay.

Another attraction may be premature when existing capacity sits idle midweek.

Compare incremental demand, operating complexity and capital intensity before deciding what to build.

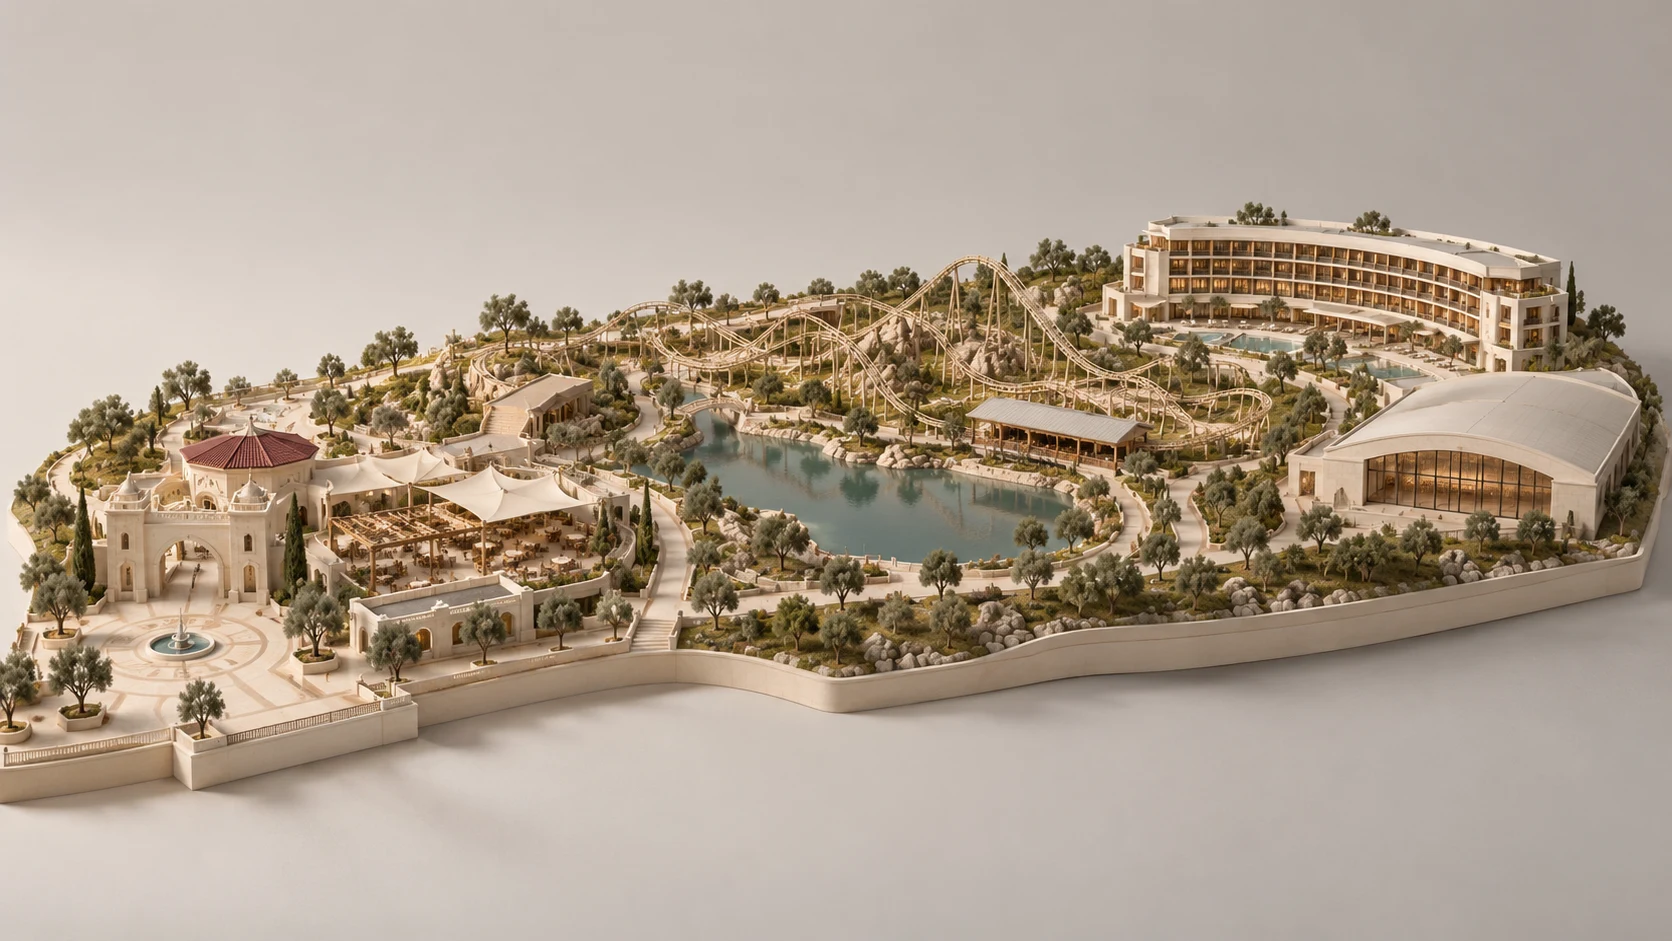
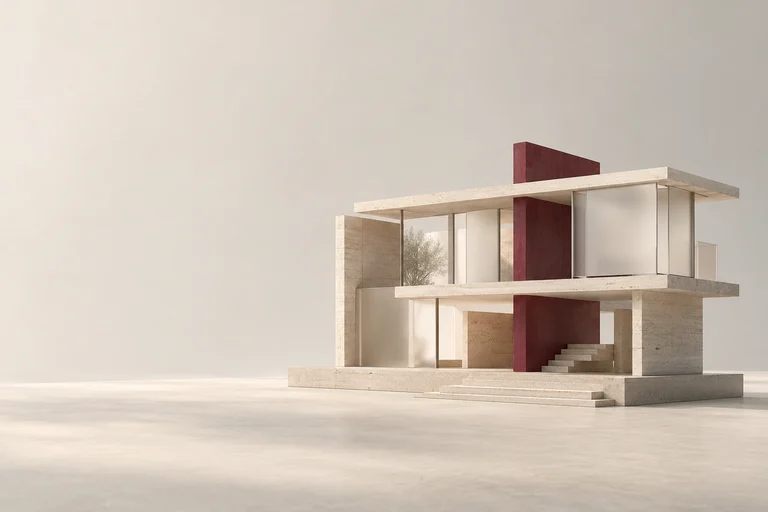
An architectural park model connects attractions, a dining courtyard, landscaped paths and a resort hotel around a shared lagoon.

The hotel investment test

A hotel must add earnings across the resort.

Room revenue is only part of the case. A hotel may attract distant guests and add park days, meals and evening spending.

Test how much is genuinely additional before committing to construction.

Test the hotel investment

Establish additional demand. Estimate occupied room nights by season, the achievable room rate and the extra park days generated by those stays.

Remove displaced revenue. Exclude stays moved from existing resort hotels and spending guests would have made anyway. Allocate package revenue once across the trip.

Build the operating case. Deduct distribution, housekeeping, staffing, utilities and maintenance. Include extra park and dining costs alongside the related revenue.

Test the investment return. Compare project cash flows with construction, pre-opening, working-capital and future refurbishment needs. Stress-test slower occupancy growth and lower room rates.

If the case depends on every guest staying longer, validate that behavior before approving the full project. A hotel partnership or smaller first phase may offer a better starting point.

Growth strategy
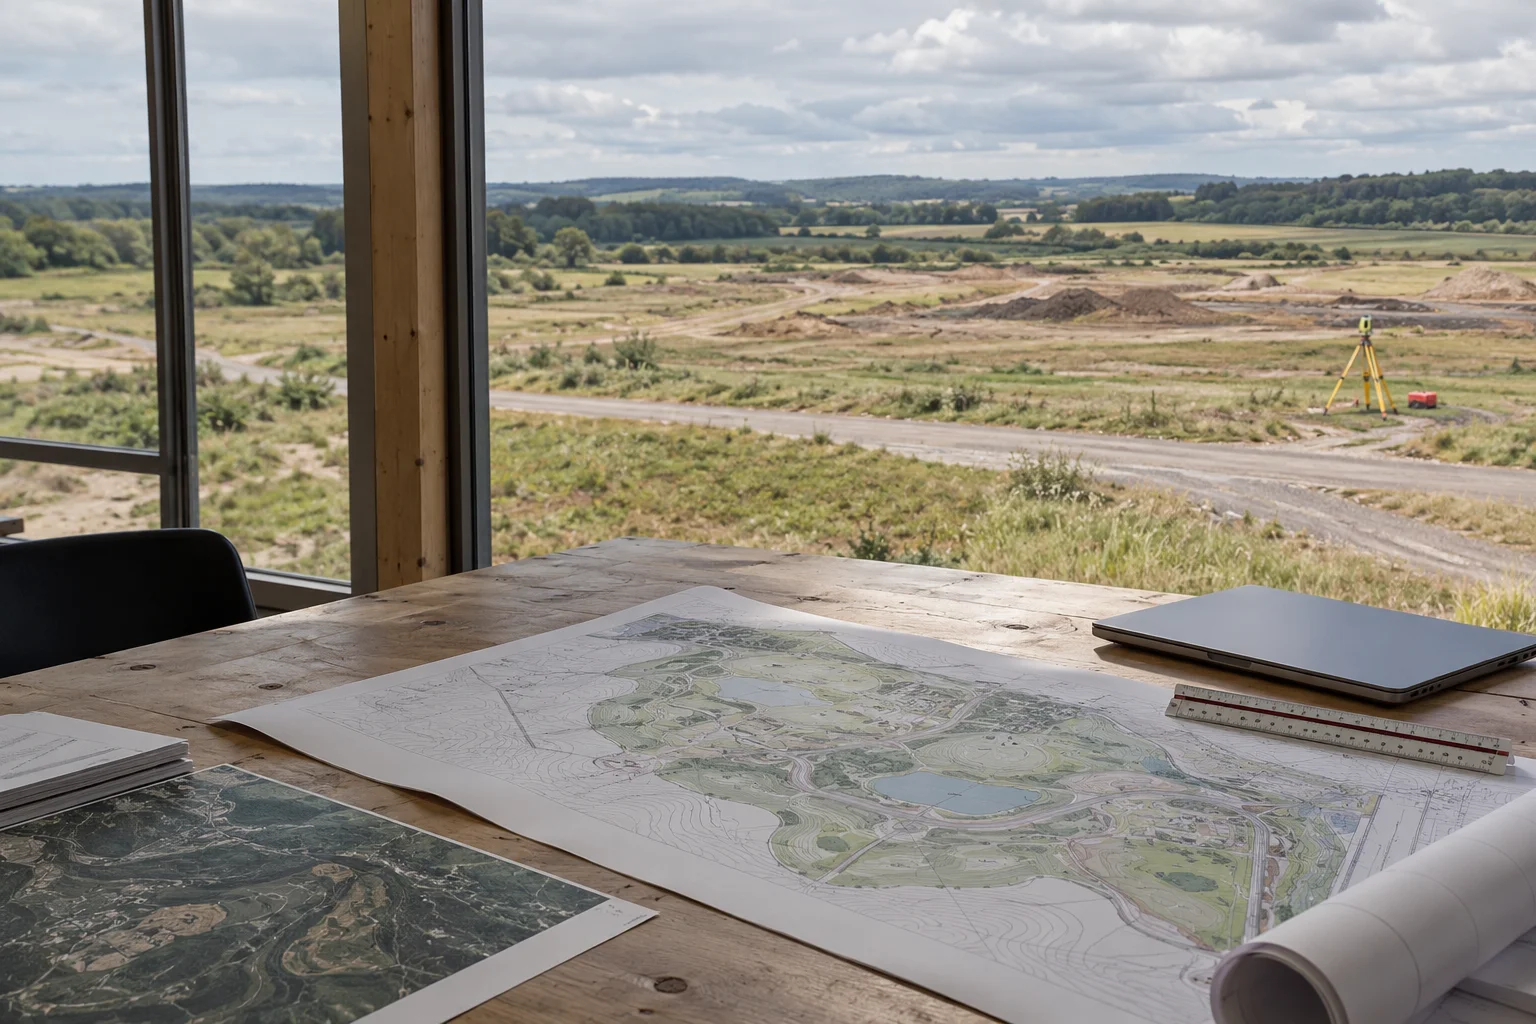
Site plans in a planning office overlooking undeveloped land.

Theme parks

Greenfield theme park planning

The business case must shape the park’s master plan.

A theme park feasibility study must connect demand, operating capacity and whole-life cost before the master plan is fixed.

For a 2027+ development, use that case to govern site selection, funding, opening and expansion.

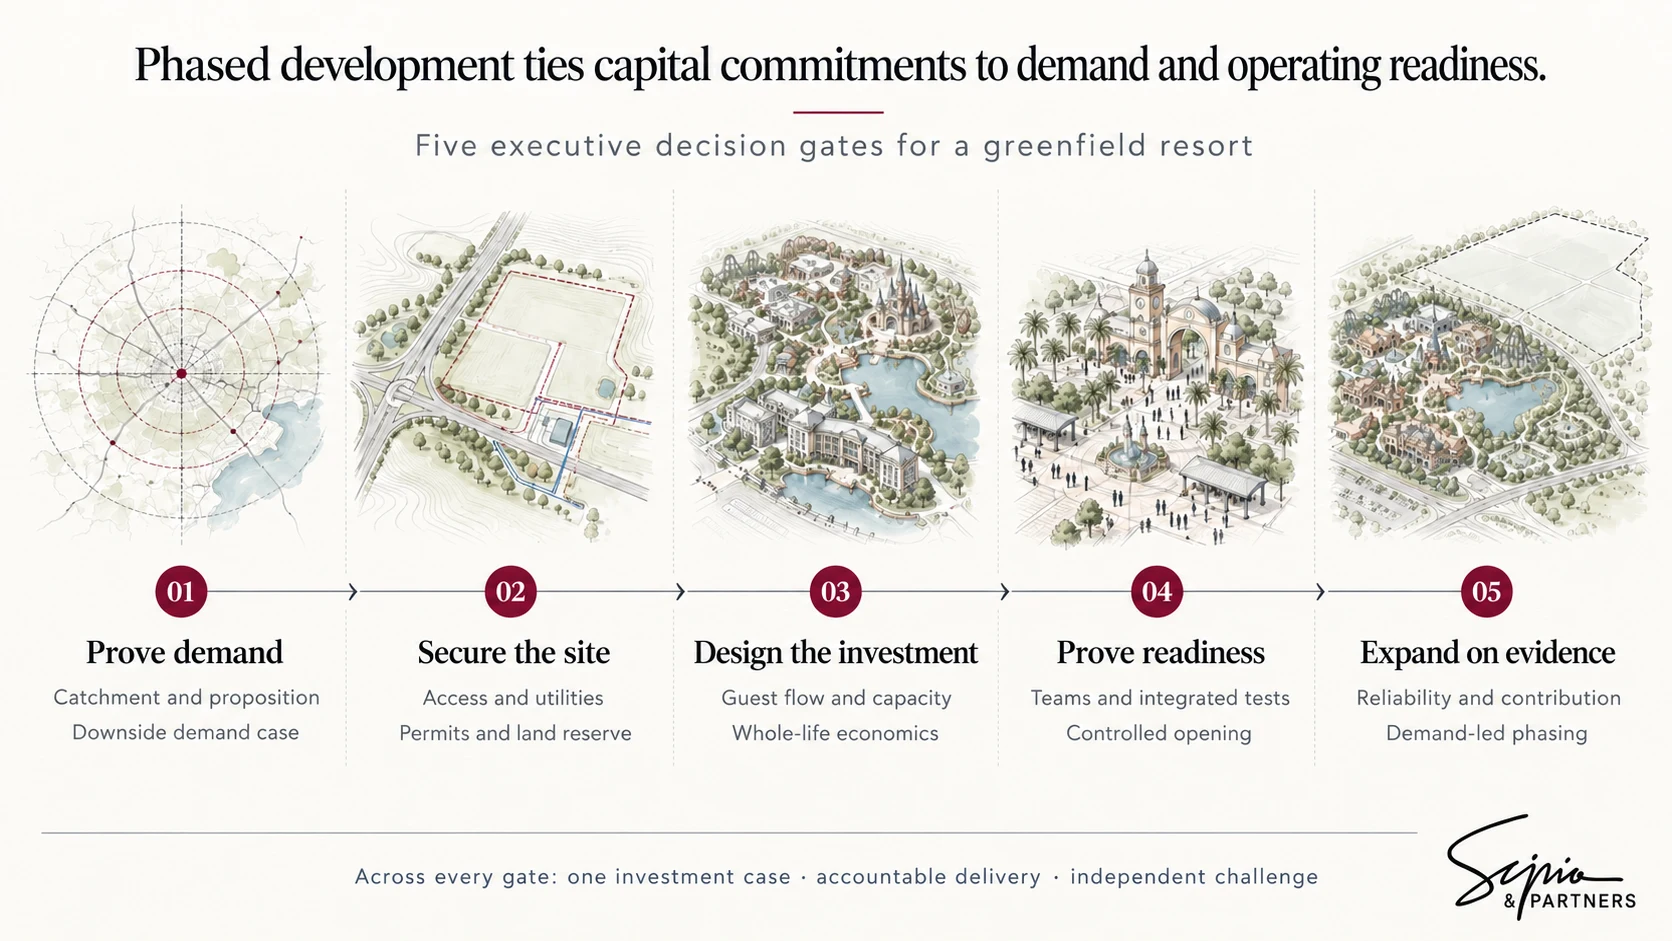
Phased development ties capital commitments to demand and operating readiness.

Five executive decision gates: prove demand, secure the site, design the investment, prove readiness and expand on evidence. One investment case, accountable delivery and independent challenge connect all five.

Five decisions structure the development program. Expand each gate below to see the evidence the board should require.

View full size greenfield decision gates (opens in a new tab)
Prove demand before fixing the conceptDefine the customer, the trip and the reason to choose your destination.

Model drive and flight catchments, household spending, seasonality, repeat visits and competing uses of leisure time.

Test the attraction mix and willingness to pay with the intended audience.

Separate the draw of intellectual property from its royalties, renewal terms and approval dependencies.

Board decisionApprove a demand case with an independently challenged downside, including slower ramp-up and lower spending per visit.

Secure the site’s ability to operateTreat access, utilities and permissions as critical-path investments.

Validate land rights, ground conditions, transportation capacity, power, water and waste treatment before the master plan hardens.

Include climate exposure, staff travel and lodging where needed.

Agree who funds and delivers off-site infrastructure, and reserve land and utility capacity for expansion.

Board decisionCommit against evidenced permissions, infrastructure responsibilities and delivery dates, with unresolved dependencies visible to the board.

Design the guest day and the full investmentMake experience, hourly capacity and whole-life cost work together.

Simulate arrival peaks, ride throughput, show schedules, food-service demand and walking routes; allow for downtime, accessibility and bad weather.

Separate guest circulation from deliveries and maintenance.

Budget land, enabling works, attractions, hotels, digital integration, pre-opening teams, working capital, contingency and future renewal.

Board decisionApprove a funded, phased plan with an operating model, independent cost challenge and clear interfaces between construction, attraction suppliers and the future operator.

Open against evidence of readinessBuild the operating team while the destination is being built.

Bring operators and maintenance specialists into design reviews.

Test ticketing, payment, access and hotel entitlements as one guest journey.

Train teams, provision spares and rehearse disruption and emergency responses with qualified specialists.

Use controlled openings to test the combined system under load.

Board decisionRelease capacity only when safety approvals, staffing, reliability and guest-service thresholds are met; an opening campaign cannot substitute for readiness.

Expand when the operating evidence supports itUse the first seasons to refine the offer and release the next phase.

Track contribution by visit and stay, attraction availability, queues, guest satisfaction, repeat demand and hotel performance.

Distinguish a temporary launch surge from sustainable demand.

Fix the operating constraint before adding another one, and retain land and design options without committing all the capital upfront.

Board decisionFund the next phase against demonstrated demand, delivery capability and a refreshed downside case.

Each site needs its own demand and infrastructure case.

Use the same decision discipline across regions, with demand and delivery assumptions built for each site.

Adapt the plan to the market

In North America, distinguish a regional drive market from a vacation destination.

Across EMEA, test seasonality, heat and tourism infrastructure by location.

In Asia, assess metropolitan density, domestic travel patterns and transportation connections at city level.

Each site needs its own staffing, water, power, access and spending assumptions.

Market entry

Investment & operations

Questions for owners and operators.

We connect commercial strategy, investment choices and delivery across North America, EMEA and Asia.

How should a park balance attendance and spend per guest?

Start with contribution by visitor segment, visit date and ticket type.

A discounted visit on a quiet day can be attractive; the same offer on a constrained day may displace a higher-value visit and add queues.

Assess admission, food, merchandise and paid experiences together, then check satisfaction and repeat intent.

Averages alone can hide an unprofitable promotion or an overloaded peak day.

What belongs in a theme park feasibility study?

A defensible study connects catchment demand, tourism flows and willingness to pay with the proposed attraction mix, access, operating calendar and deliverable capacity.

The financial model needs construction and pre-opening costs, staffing, maintenance, utilities, working capital and future renewal.

Test a slower attendance ramp, weather disruption, cost escalation and lower guest spend before setting the funding envelope.

When does a hotel or new themed land strengthen the investment case?

When it creates incremental visits, length of stay or contribution that survives the full cost of delivery.

Separate genuinely new demand from spending moved out of another park, hotel or attraction in the portfolio.

Include distribution commissions, intellectual-property fees, staffing, maintenance and replacement capital.

A strong destination story still needs a credible cash-flow case.

Where can AI make theme park operations more effective?

Practical starting points include forecasting attendance, recommending staffing and food preparation, triaging guest-service requests and identifying maintenance patterns.

Each needs an accountable operator, reliable data and an evaluation against today's process.

Keep safety-critical decisions within established engineering and operating controls, and give teams a clear route to override recommendations.

Our expert network

Theme park expertise
with a global reach.

30+

theme park experts
in our global network

  • NORTH AMERICA
  • APAC
  • EMEA

Related industries.